NovaLoca Regional & Sector Disposals Report Q1 2023
NovaLoca Regional & Sector Disposals Report Q1 2023
For NovaLoca’s latest disposals report we looked at over 44,000 property adverts, comparing properties listed on the 1st of January 23 with those listed on the 1st of April 23 (only including properties from companies that were listing throughout the period). Close to 40 companies have joined us since the 1st of January so we look forward to their listings being included on our next disposals report. Details and exact dates of deals were not collected but those no longer registered as available or under offer at the end of the period were counted as ‘disposed of’.
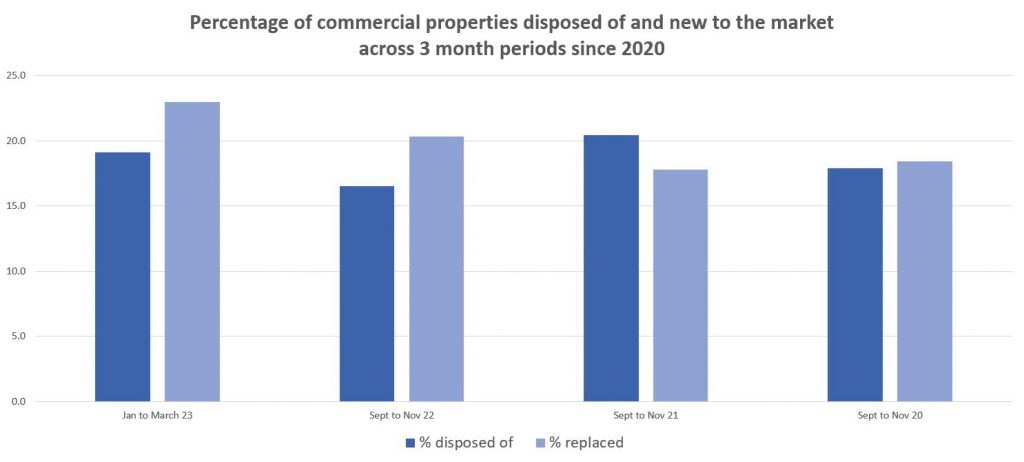
Across all sectors & regions 19.1% of those listed at the beginning of the period had been disposed of by the 1st of April (compared to 16.5% in the 3 months to 1st Dec 22, 20.45% in same period in 2021 & 17.9% in 2020). These disposals were replaced with new instructions amounting to 23 % of the original portfolio number (compared to 20.3% in the 3 months to 1st December last year, 17.8% to December 2021 & 18.4% to December 2020).
The data seems to show an overall higher level of movement compared to previous periods. Demand remains below supply by a similar percentage compared to the end of 2022.
*Ref NovaLoca Disposals Report 2022 – NovaLoca Blog NovaLoca Disposals Report 2021 – NovaLoca Blog NovaLoca Disposals Report 2020 – NovaLoca Blog
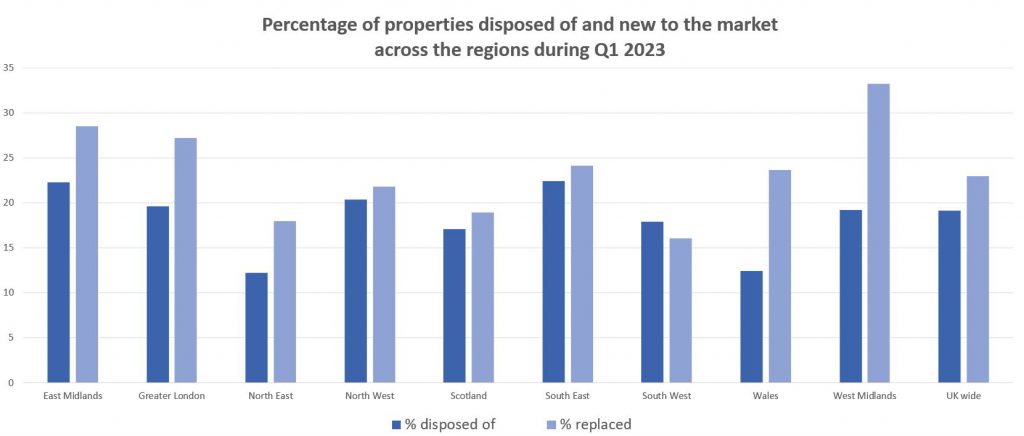
Disposals by Region
The South East & The East Midlands are showing the highest disposal levels with the North East & Greater London also showing just above average disposal rates. New instructions are highest in the West Midlands followed by East Midlands, Greater London & the South East. The largest discrepancy between disposals and new instructions is seen in the West Midlands & Wales followed by Greater London & the East Midlands, potentially indicating more of a buyer’s market in these areas. Property in the South West appears to be the most in demand as the only region indicating more disposals than new instructions during the period.
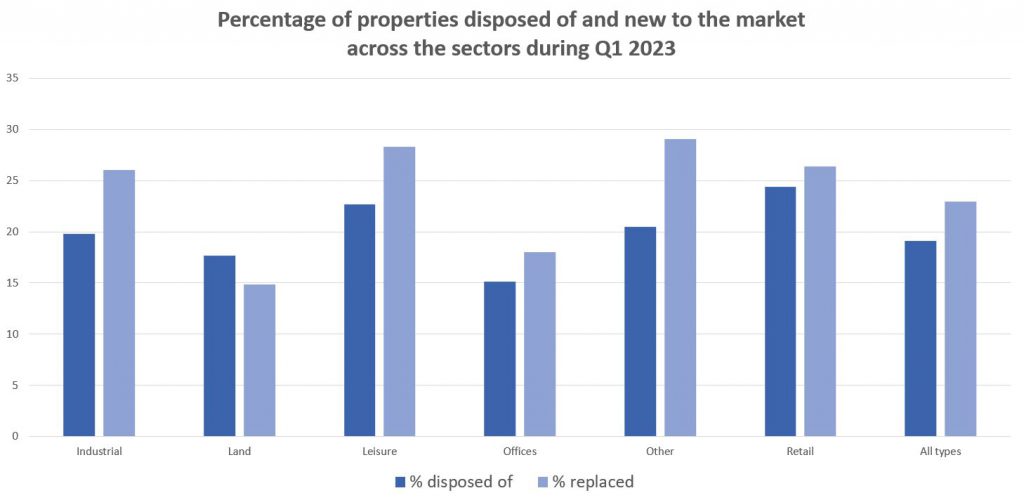
Disposals by Property Type
Disposals are highest in Retail followed by Leisure, Other and Industrial but the relatively high replacement rates in Leisure, Other & Industrial show a plentiful supply in these sectors. Replacement rates are fairly similar to disposals in retail with only slightly more units coming onto the market than leaving it. Land is the only sector showing more disposals than new instructions. Office shows the lowest levels of disposals, this was also the case in our 2021, 2020 & 2019 reports. 2022 saw the sector second lowest to land disposals. It is important to note however, that these results are primarily for conventional offices. The majority of serviced office disposals are excluded from our research.