
NovaLoca September to December 2024 Disposals Report
The 2024 NovaLoca Disposals Report reveals that supply continues to be higher than demand with more properties coming onto the market than leaving it.
For NovaLoca’s latest disposals report we analysed a total of 50,495 property adverts, comparing properties listed on the 1st of September with those listed on the 1st of December (only including properties from companies that were listing throughout the period). Eight companies have taken out new subscriptions with us since the 1st of September (in addition to those adding individual listings) so we look forward to their listings being included on our next disposals report. Those properties available at the beginning of the period that were no longer listed at the end were counted as ‘disposed of’.
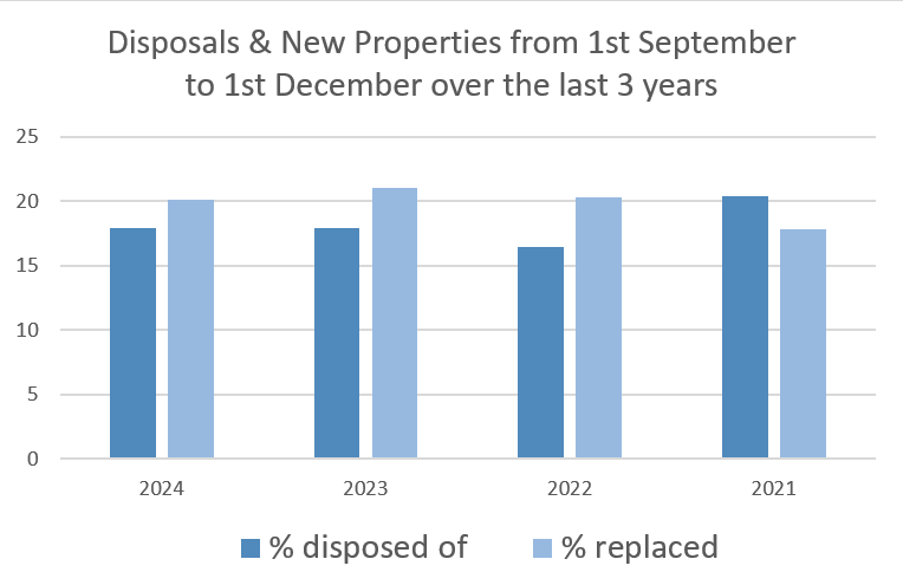
Supply continues to be higher than demand with more properties coming onto the market than leaving it. Disposals are at the same level as this time last year and as last year, all disposals were more than replaced with new listings (but at a very slightly lower level than in 2023).
17.92% of properties listed at the beginning of the period had been disposed of by the 1st December (compared to 17.89% in 2023, 16.5% in 2022 & 20.45% in 2021). 112% of those disposed of were replaced (117% were replaced in the same period last year 123% in 2022 & 87% in 2021). This is a replacement of 20.09% expressed as a percentage of the original portfolio number compared to 21.08% in 2023, 20.3% in 2022 & 17.8% in 2021.
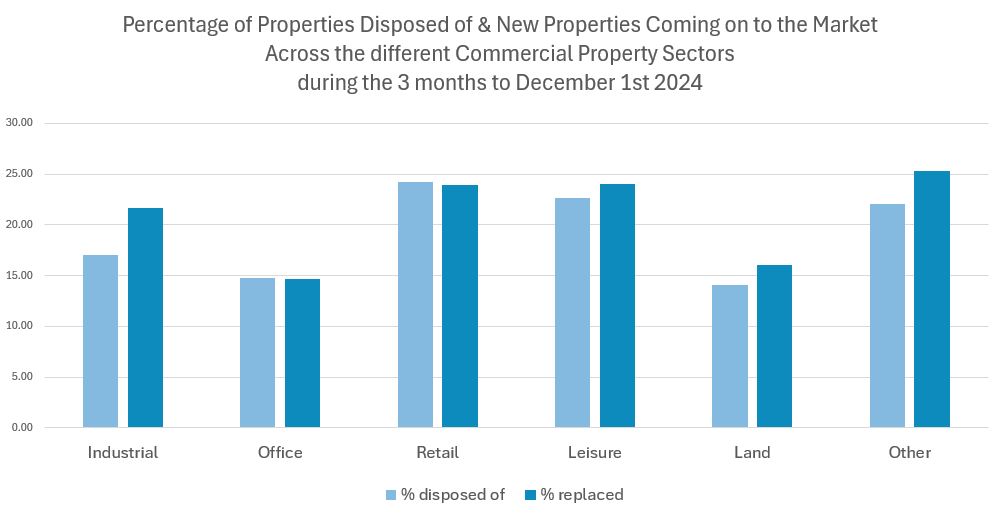
The general trend, of more properties coming onto the market than coming off, is most marked for industrial property. Disposals and newly listed properties for industrial property are similar but slightly down on last year. Office disposals, despite remaining low, are up on last year with replacement new properties very slightly lower, potentially indicating recovery in the sector. Least disposals are for land with new listings in land higher than disposed of (but not as high as last year). Of the main sectors retail seems to be performing best with a slightly less new properties comping onto the market than leaving it. Leisure is also performing well with only slightly higher supply than demand.
Highest number of disposals
The Top 5 companies with the highest number of disposals accounted for almost 21% of all disposals.
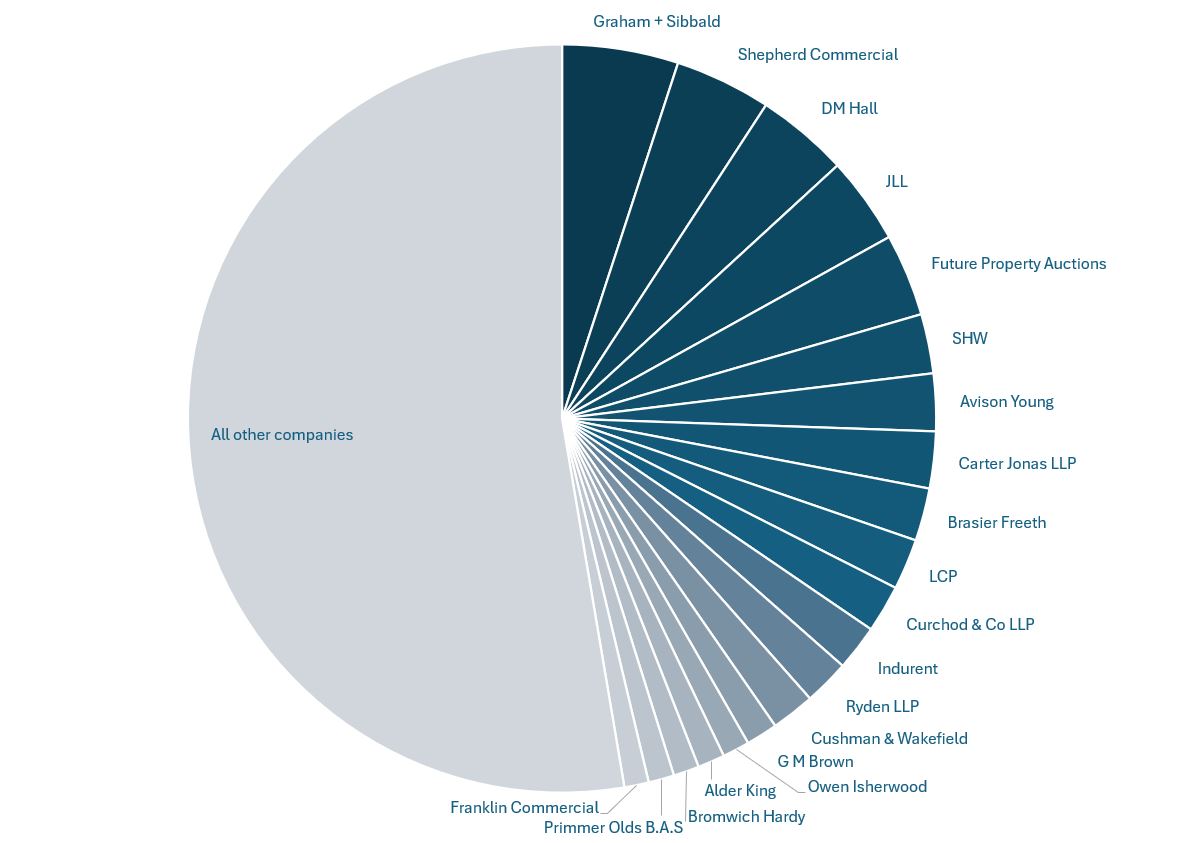
Graham + Sibbald are in 1st place accounting for 5.02% of all disposals, Shepherd Commercial are in 2nd place with 4.16%, DM Hall take 3rd place with 3.99%, JLL are holding in 4th position, accounting for 3.76% of disposals and Future Property Auctions are in 5th place accounting for 3.56% of all disposals.
Top companies by percentage of portfolio disposed of
As before we looked at companies with an initial portfolio of 25 or more available property listings. Our top 5 disposed of the highest percentage of their initial portfolio. In first place we have Online Property Auctions Scotland disposing of 53% of their portfolio. In second place is TSA Property Consultants with 50% of their portfolio disposed of, third place goes to Holder & Co Limited with 48%, Centro Commercial Ltd disposed of 37% putting them in fourth place and fifth place goes to Michael Steel & Co with 36%.
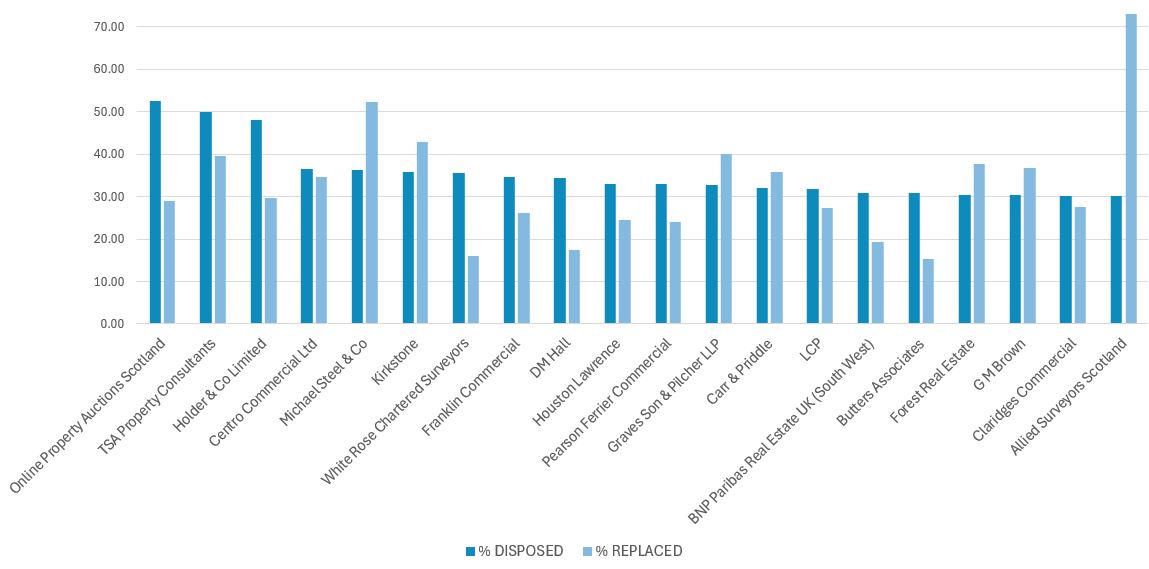
With average disposals at 18% all of our top 5 are disposing of more than double this amount. All of our top 20 below disposed of more than 30% of their portfolio.
Please note that disposals & new properties are counted at the date the changes are made within the NovaLoca database. Therefore, where companies update their listings less often this could result in higher disposals & new listings being recorded than actually took place during the period. The majority of the companies in our chart below either feed data direct or update regularly, however, to be confident of any specific result we suggest you contact the company directly.
You can find the results from our 2023 disposals report here 2022 disposals report here and 2021 can be seen here.