Showcasing Commercial Properties: Captivating Infographics
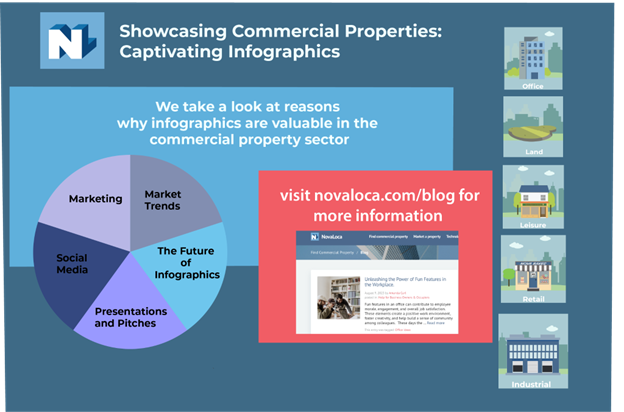
Infographics are visual representations of information, data, or complex information in a clear, concise, and engaging manner. In this blog we are going to take a look at some of the reasons they are particularly valuable in the commercial property sector:
- Marketing
- Infographics can present property features, market trends, and other data in a simplified manner to make it easier for potential clients, investors, or tenants to understand and interpret
- Elements that can showcase the key features and benefits of a commercial property such as: amenities, a map to show the property’s location, an illustration of the property layout, floor plans, and interior designs allow possible occupiers or purchasers to better visualise the space and understand its potential.
- Market Trends
Infographics can effectively present different types of market trends. Tailor the information for each trend and the particular audience you are presenting the data to, to effectively convey the information and support the main message of the analysis.
- Charts or Bar graphs can show historical price trends in a particular area or market segment, vacancy rates and present data on the performance of specific industries (e.g. industrial, leisure) and how they impact the demand for commercial properties in different locations.
- Maps and heatmaps can illustrate how different locations perform in terms of property values, rent prices, and market activity. This helps stakeholders identify lucrative markets and areas of interest.
- Infographics can also use trend lines or bubble charts to illustrate future projections for property prices or demand. This assists in long-term planning and decision-making.
- Social Media
Social media is a powerful tool for marketing in the commercial property sector. Here’s a few reasons why infographics can help boost engagement, shares, and likes across various social media platforms and a few tips on what they should include and how they should look. Don’t forget to tailor the infographic’s size and format to suit the requirements of each social media platform.
- Eye-catching Visuals: Infographics are visually attractive so they stand out in social media feeds. Make sure to use vibrant colours, compelling graphics, and clean design to catch the audience’s attention and encourage them to stop scrolling.
- Simplified Information: Infographics present information in a concise and easy-to-understand format. People are more likely to engage with content that doesn’t require much effort to consume and provides valuable insights at a glance.
- Shareability: Due to their visual nature and the ability to convey information quickly infographics are highly shareable. When people find infographics informative or entertaining, they are more likely to share them with their followers and networks.
- Call-to-Action (CTA): Include a clear call-to-action on the infographic, encouraging viewers to like, share, or comment on the post. An explicit CTA can prompt more active engagement from the audience.
- Presentations and Pitches
Investor presentations play a vital role in securing funding for commercial property projects. Infographics can enhance investor pitches by presenting key data, financial projections, and property details in a visually compelling and persuasive manner.
- Highlight Financial Projections: Use infographics to showcase financial projections, including revenue forecasts, ROI estimates, and cash flow analyses. This can be presented through such things as line charts or stacked bar graphs.
- Visualise Property Performance: Infographics allow you to visually demonstrate the property’s historical performance, occupancy rates, rental income, and vacancy trends. Comparative charts can be used to showcase the property’s performance against similar properties in the market.
- Case Studies and Success Stories: Use infographics to present case studies or stories of previous successful projects.
- Convey Growth Strategies: Infographics can visually present your growth strategies, development plans, and expansion opportunities. This helps investors understand the potential for value creation and long-term prospects.
- The Future of Infographics
As technology evolves, so do infographics. Interactive infographics have elements that are triggered by a reader’s actions, such as clicking or scrolling. They are particularly useful when dealing with large datasets, complex processes, or when wanting to provide users with a more immersive and hands-on learning experience. Let’s take a look at some common features and characteristics of interactive infographics that can offer a more personalised and enhanced experience.
- Clickable Hotspots: Interactive infographics may have clickable hotspots that provide additional information when users hover their cursor over specific parts of the graphic.
- Animated Elements: These can include animations or transitions to illustrate processes or changes over time.
- Data Filters: These allow users to apply data filters to view specific subsets of information or adjust parameters to focus on particular aspects.
- Sliders and Dragging: Use sliders or drag elements to dynamically adjust data values or change visual representations.
- Embedded Videos: Incorporate videos that provide further insights or explanations related to the content.
- Scrolling or Parallax Effects: Scrolling or parallax effects (where background and foreground content move at different speeds) can reveal different layers of information as the user navigates through the content.
- User-Driven Navigation: Allow users to control the sequence of information they consume and explore different aspects of the content based on their interests.
Remember to make sure the infographic aligns with the company’s branding, so include the firm’s logo, colours, and fonts. Consistency in branding helps reinforce identity.
If necessary include data sources and references to support the presented information. This transparency shows that your data is reliable and well-researched.
In conclusion, infographics have emerged as a useful tool in the commercial property sector. From captivating marketing materials to data-driven insights, the visual power of infographics can play a role in driving success in the competitive world of commercial property. As the industry continues to evolve, embracing innovative technologies and creative approaches will be key to staying ahead in the game.
For some inspiration click here, to conduct your search for commercial property visit our main page here.