How to use Descriptive Analytics for your Business
Having taken the time to train in marketing analytics for your business it’s time to consider just what it is you want to be analysing. In other words you need to know what your business goals or key performances indicators (KPI’s) are so you can know if they’re being met. The more specific you can be with your objectives the better able you will be to measure when and whether they have been reached. It is important to consider if your goal is actually attainable and what your time frame is to reach it.
You could then go on to use descriptive analytics. This is the process of looking at what has already happened in your business and forming a summary from the data gathered. This data may come from many sources such as your website and social media channels. The summary makes it simpler to understand parts of a larger amount of data (e.g you can note whether one type of product is selling more, and if it is selling better at a certain time of the year). Then you can make decisions on future actions. The summary should only include actual facts such as how many web page views there has been. It should not contain predictions or speculations.
Once you have your data summary you need to decide how best to present your findings. You have several data visualization options:
Pie Charts
These are good for showing the differences between two or more pieces of data, such as the type of devices your customers use to view your website, but they work best when there are less than 4 main pie pieces so no section is too small.
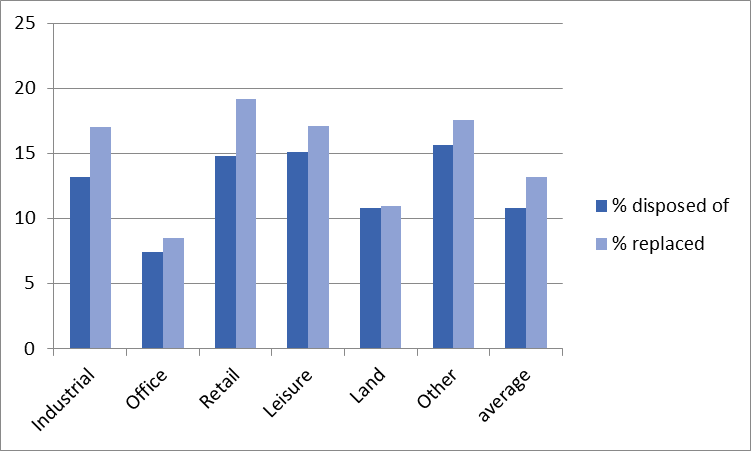
Bar graphs
Graphs that are useful to show comparisons. NovaLoca often use these to compare such things as the numbers of different commercial property types being disposed of, and replaced on site by our agents during a particular period.
Line graphs
These reveal changes, trends or progress over time. Web traffic for a specific period is typically reported in this way in Google Analytics.
Word Clouds
Word clouds visualise data by presenting words in various sizes depending how often they appear in your data. They can be useful for spotting which topics are mentioned more than others. There are free online word cloud generators available. Here’s one based on our blog created at wordclouds.com. As our blog is designed to provide help and advice for small businesses, as well as commercial property news, we know we are on the right track when we see the dominance of associated words for these subjects.

Have to agree!
I love a word cloud!